

In this post, we will discuss five simple money moves to make now in case of a recession. But first, our disclosure:
Disclosure: This post may contain affiliate links, meaning we earn a commission on purchases made through those links at no extra cost to you. As an Amazon Associate, I earn from qualifying purchases.
Disclaimer: Not Financial Advice: The content on this site is for informational and educational purposes only and does not constitute professional financial, investment, legal, or tax advice and should not be used as a substitute for professional advice. For more details, read our full Disclaimer.
Tariffs, Uncertainty, and Recessions, Oh My!
There is a lot of uncertainty in the market right now. The Trump administration plans to impose 25% tariffs on Canada and Mexico, increase tariffs on China, and introduce reciprocal tariffs on other countries. It is unclear what will happen next.
Will inflation go up? Will the labor market suffer, leading to a weaker economy? Or will the tariffs bring more manufacturing back to the U.S., strengthening the economy in the long run? We cannot know for sure, but one thing is clear: people and markets hate uncertainty.
I have lived through many uncertain times, starting with the dot-com bubble and continuing to 9-11, the Great Recession, COVID-19, and the worst inflation in decades. In my first “real” job after college, the company I worked for went bankrupt within a year of my joining. Through all these experiences, I’ve learned that the best thing we can do is prepare and focus on what we can control.
While we cannot control whether the government imposes a 25% tariff on Canada, we can control how we spend our money. We may not be able to influence home prices, but we can decide how to invest our cash. We may not be able to control being laid off, but we can try to save for that eventuality.
The bottom line is that the best way to protect your money from uncertainty is to prepare today for tomorrow. Don’t be lulled to sleep during the good times; that is the best time to prepare. There are five simple money moves anyone can take today to prepare for tomorrow, and no, I am not talking about the dreaded B-word: budget. So, let’s dive right in and check out the first one.
Money Move #1: Remain Calm
No one is immune to their emotions. There is nothing like a bear market to shake one’s confidence. When the markets are down 20% or more, it can be difficult to resist the urge to panic. However, I have learned that the key to success is to do the opposite,
The number one money rule during uncertain times is to remain calm. Panic can quickly set in when markets fall, and job losses mount. However, panic leads to desperation, and desperation leads to poor money decisions.
Panic activates our fight-or-flight response, causing many people to make rash, emotional decisions in the heat of the moment. Emotions can cloud our judgment and create an artificial sense of urgency in our decision-making process. This pressure can be hard to resist, especially when news media and social media influencers take advantage of the panic for profit.
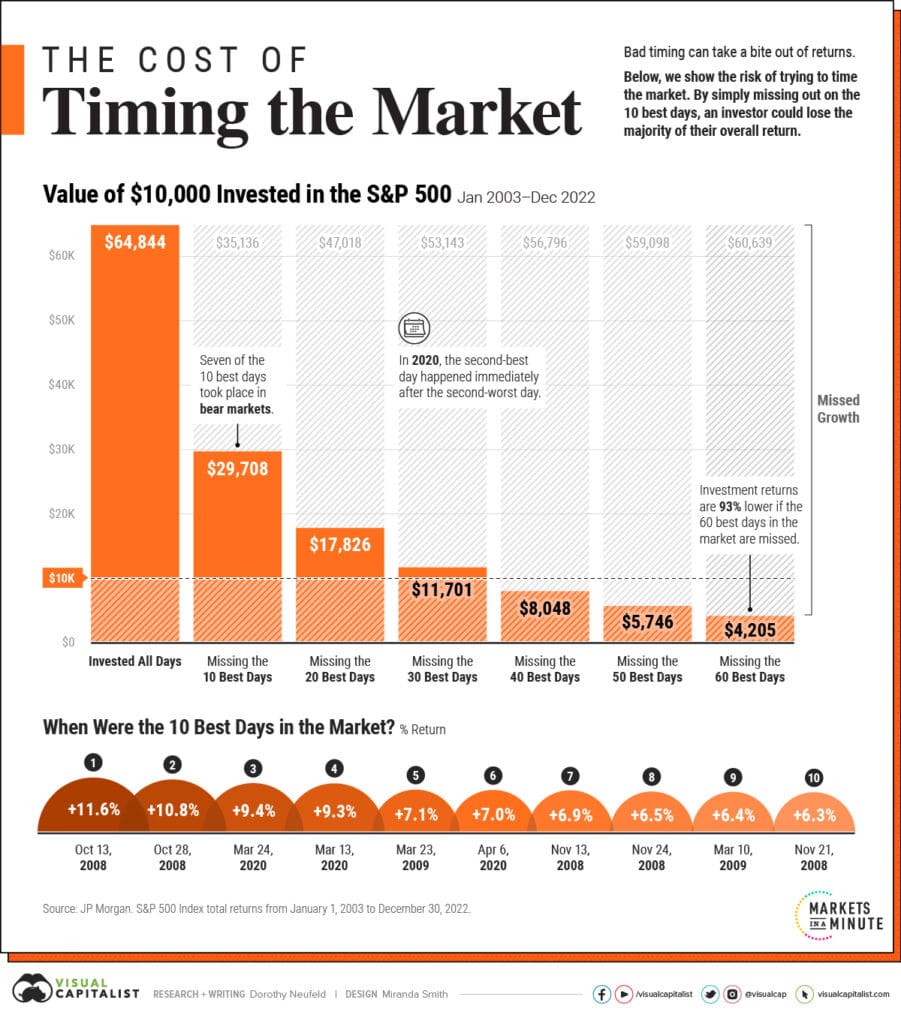
Panic can cause investors to sell or halt their investments, which may lead them to miss some of the best trading days in the market. Missing just a few top trading days over a decade or more can significantly impact overall investment returns. Interestingly, many of these best trading days often occur during bear markets, which throws a lot of cold water on the concept of timing the market.
According to the website Visual Capitalist and their chart below, between 2003 and 2022, seven of the ten best trading days took place during bear markets. The most surprising aspect of the chart below is that if you invested in the S&P 500 and missed 10 of the best trading days over those 20 years, your returns would have been cut in half!
When In Doubt, Zoom Out
Markets are volatile, especially when looking at their daily, weekly, or monthly price movements. So, when in doubt, zoom out to get a bigger picture of what is happening in the markets.
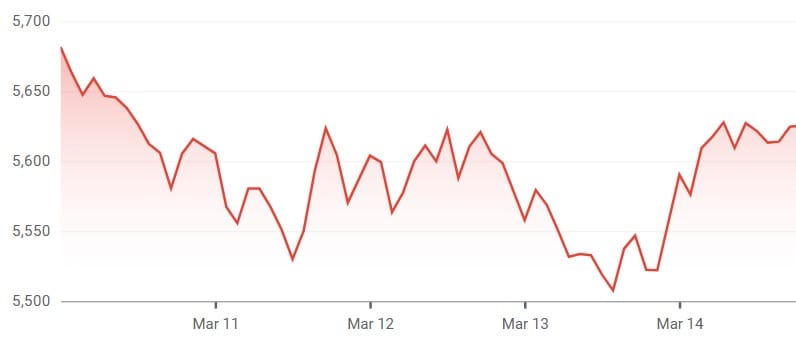
For example, the screenshot below illustrates the price fluctuations of the S&P 500 index over a selected five-day period. The graph showcases a series of sharp rises and steep declines, creating a somewhat unsettling picture. The dramatic ups and downs captured in the chart highlight the unpredictability of market movements, especially over the short term, reminding investors of the inherent risks involved in trading.
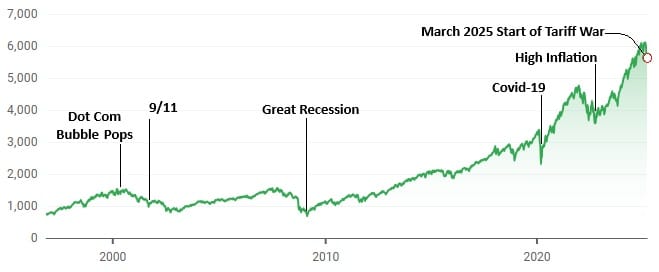
When zooming out on the S&P 500’s long-term trajectory over the past 29 years, as illustrated in the chart below, its performance looks quite different. Even significant economic downturns, such as the Great Recession of 2007-2009, look like a slight dip in the upward trend. This long-term view highlights the market’s resilience and the potential for recovery and growth over time, emphasizing that short-term fluctuations may not significantly alter the index’s long-term upward momentum.
However, it is important to remember that past performance does not guarantee future results, so invest at your own risk.
Learn More
Check out The Little Book of Behavioral Investing by James Montier and discover the profound ways your emotions shape your investment choices. This insightful read will equip you with the knowledge to navigate your investing decisions with greater awareness and confidence.


Money Move #2: Calculate Your Net Worth
Calculating your net worth is one of the simplest yet most powerful money moves you can make. Knowing your net worth provides a financial snapshot, showing you where you stand financially at a specific point in time. It is not just for the rich and famous. It’s for everyone and only requires simple grade-school math.
Net worth is calculated by subtracting your total liabilities (what you owe/debts) from your total assets (what you own).
Understanding your net worth is important because it provides a baseline for tracking your financial progress and identifying potential issues. If your net worth is increasing over time, it indicates that you are building wealth through saving and investing while controlling your spending and debt. On the flip side, if your net worth is decreasing, it may suggest that you are overspending, not saving or investing enough, or not earning a sufficient income.
Surprisingly, many people do not know their net worth.
According to Credit Karma, 67% of Americans don’t track their net worth, and 51% don’t know how to. Not knowing your net worth is financially dangerous. It’s like never checking your blood pressure or cholesterol. Without knowing your financial numbers, how can you assess your financial health? How can you make informed changes and improvements if you remain unaware of your financial situation?
It’s time to take control of your financial future by understanding where you stand.
How To Calculate Your Net Worth
Net worth is calculated by subtracting your liabilities from your assets. Assets are items you possess that have value, such as cash, bank accounts, the equity in your house, and your investments. They include the value of your retirement accounts. On the other hand, liabilities are what you owe, like debt, credit card balances, student loans, mortgages, and car loans.
To calculate your net worth, list all your assets and liabilities organized by account. It doesn’t need to be fancy or take a long time; jot down the totals for each account. You can do it using a pen and paper, a spreadsheet, or an online net worth calculator. Once you have gathered this information, subtract your total liabilities from your total assets to calculate your net worth.
Don’t panic if your net worth is negative. The point of this exercise isn’t to make you feel bad. Instead, it is to empower you with the knowledge to make changes today for your tomorrow. It’s a simple money move that can inspire change.
You can calculate your net worth as often as you like. Many money experts recommend calculating it at least once a year. I prefer monthly, whereas others prefer quarterly. No matter how often you decide to calculate your net, know that simply doing it puts you ahead of 67% of Americans. Now that’s something to hang your hat on!
Below is an example of a net worth tracker.
Money Move #3: Review Your Spending
Now that you understand your net worth and have a clearer overview of your finances, it’s time to take a closer look at your spending. This money move doesn’t involve creating a budget; it involves examining your spending to identify potential areas for reducing expenses. Don’t underestimate the power of this step. Cutting expenses now is one of the best ways to prepare for a recession. The less you owe, the more you save.
This money step does not need to be complicated. For instance, pull up your bank and credit card statements and look for surprise charges, like the “free trial” subscription now costing you $20 monthly. Look for trends eating your finances alive, like restaurants and food delivery services (pun intended).
Once you know your spending habits, it’s time to identify areas where you can reduce expenses. For example, if you currently eat out eight times a month, try to reduce it to four times. If you’re paying exorbitant fees and tips for grocery delivery every week, consider limiting it to once a month and going to the store during the other weeks.
Keep in mind that the amount to cut depends largely on the results from the previous step. If you have a positive net worth, with sufficient savings and investments and minimal debt, drastically cutting your spending may not be necessary. However, if you are drowning in debt and your credit card balances exceed the amount in your retirement account, it might be time to take drastic action.
How To Get Out Of Debt?
If you are overwhelmed by debt, it is time to roll up your sleeves and get to work. I recommend starting with a few books for inspiration if you’re unsure where to begin. Below is a list of personal finance books I enjoyed, each offering a unique perspective on getting out of debt and building wealth. While Dave Ramsey’s “Total Money Makeover” is the most well-known, the other two books provide valuable insights and a different approach.
No matter what you choose, be it a book from the list below or something else, remember: if at first you don’t succeed, try, try again.


Money Move #4: Save For A Rainy Day (or Recession)
According to Bankrate’s 2025 Annual Emergency Savings Report, 33% of Americans have more credit card debt than emergency savings. More than 69 percent would be very or somewhat worried they could not cover one month of living expenses if they lost their primary income source. That’s scary! The best way to prepare for such an event is to build an emergency fund.
An emergency fund acts as a safety net, ensuring you have enough money to cover essential costs such as rent or mortgage, utilities, and groceries in the event of situations like job loss. It offers peace of mind and gives you the time to make well-informed decisions during difficult times. Remember, living expenses are the bare minimum you need to survive. They are not a dinner out at a fancy restaurant, or an upgrade to the latest smartphone.
Most financial experts recommend having an emergency fund covering three to six months of living expenses. However, certain circumstances, such as being self-employed or retired, may require a larger emergency fund. In these cases, many money experts suggest saving enough to cover nine to twelve months of living expenses or even more.
For many, saving a three—to six-month emergency fund can seem impossible. But remember, Rome wasn’t built in a day, and neither is an emergency fund. It takes time, effort, and sacrifice. You need to create a savings plan and stick with it.
How Do You Save An Emergency Fund?
The first step in building an emergency fund is to determine how much you need. Track your spending for a few months to calculate your essential expenses, including housing, utilities, groceries, gas, car insurance, and more. For example, if your total basic expenses amount to $3,000 per month, a 3-month emergency fund would require $9,000, while a 6-month fund would amount to $18,000.
If saving three to six months of living expenses feels intimidating, remember—every great achievement starts with a small step. Begin with a manageable goal; for instance, set your sights on saving one month’s expenses within six months to a year. You might be surprised at how quickly small contributions can add up—just $25 a week translates to over $1,300 a year, while $50 a week can grow to an impressive $2,600. Look at it this way: you can build substantial savings by skipping one dinner out each week. Bottom line: The more you can save each week, the faster you can grow your emergency fund.
Once you have established a savings goal, the next step is to open a separate high-yield savings account specifically for your emergency fund. Setting up automatic transfers from your checking account to this savings account is a good idea. Since your emergency fund should be easily accessible and stable, the money must be readily available when an emergency occurs. You don’t want your funds tied up in investments or certificates of deposit (CDs).
Finally, resist the temptation to use your emergency fund for non-emergencies. A European vacation or a large-screen TV are not emergencies. Instead, save up separately for those goals.
Check out Lisa Rowan’s “Money Hacks: 275+ Ways to Decrease Spending, Increase Savings, and Make Your Money Work for You!” for money-saving tips.
Money Move #5: Think Long Term
According to the National Bureau of Economic Research (NBER), the average recession in the U.S. has lasted 10 months since World War II. The Great Recession (2007-2009) was the worst recession since 1945, lasting 18 months, while the COVID-19 Recession in 2020 was the shortest at two months. What’s more, the same data from the NBER shows a growing duration between recessions.
Since World War II, the average duration between recessions has been about five years. However, according to data from the National Bureau of Economic Research (NBER), this interval has lengthened to nearly nine years since 1990. Overall, since 1945, the economy has spent more than 80% of the time in a period of expansion, compared to only 20% of the time in contraction.
This data suggests that the economy rewards those who think long-term. Individuals with a long-term perspective do not flee at the first sign of trouble; they avoid making hasty decisions driven by the panic often spread by the media and influencers. Instead, they develop a savings and investment strategy to achieve long-term wealth, even in the face of short-term challenges.
Long-term thinkers see market downturns as golden opportunities to acquire stocks at discount prices. They also build and maintain an emergency fund, allowing them to withstand unforeseen challenges without jeopardizing their financial health.
A long-term thinker prioritizes saving, minimizing unnecessary spending, and investing for the future. They resist the urge of instant gratification and focus on cultivating lasting wealth.
Conclusion: 5 Simple Money Moves To Prepare For A Recession
As the saying goes, “hope for the best but prepare for the worst.” During these uncertain times, it is now time to prepare for the worst. Don’t worry if you haven’t started yet. Remember, the best time to plant a tree was 30 years ago. The second-best time is now. There is no time like the present to begin.
As we have seen, preparing for a recession does not need to be complicated. The first step is to remain calm and not panic. Next, you must assess the situation. Start by listing your debts and assets and calculating your net worth. Once you know where you stand, it is time to take action. Look at areas where you can cut spending and start saving an emergency fund. Above all else, think long term.
Recessions come and go, and in the heat of the moment, they can be scary. You must keep your eye on the prize, and that prize is financial freedom. The journey to financial freedom is long. It is not a sprint. It’s a marathon. Remember, long-term thinkers look to tomorrow when making decisions today. Ultimately, that is the most powerful money move you can make!


