
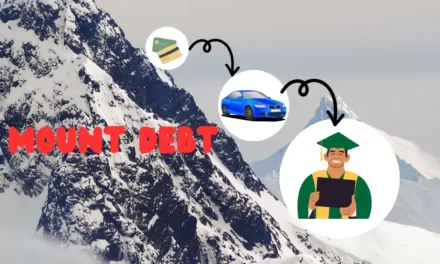
This post will discuss how owning a car can be a financial burden and provide solutions. But before we begin, here is our disclose:
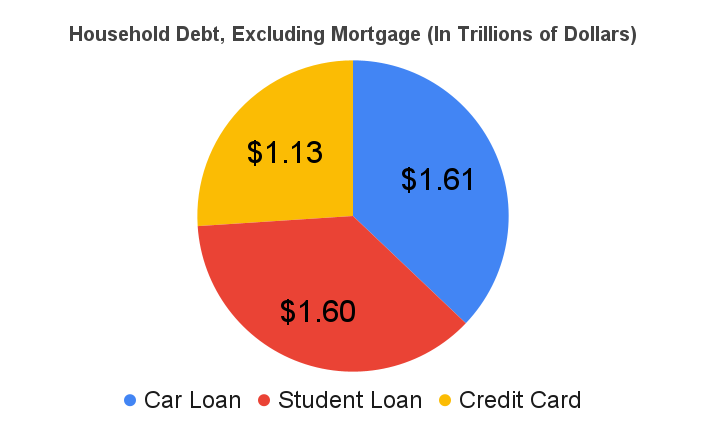
A $1.6 Trillion Car Problem
What has four wheels, sits more than runs, and is killing your bank account? No, it is not your ride-on lawn mower. It’s your car.
According to the Federal Reserve Bank of New York, Americans owe over $1.6 trillion in auto loan debt! You read that right. Americans are up to their eyeballs in auto loan debt, on par with student loans. To make matters worse, that $1.6 trillion does not account for all the expenses associated with owning a car, many of which are placed on high-interest credit cards.
Cars Are Expensive
Cars can cost tens of thousands of dollars to buy and thousands more to finance, and their depreciation rivals that of timeshares. Then there are the costs for gas, insurance, maintenance, and repairs that easily double the cost of owning your car beyond what you paid for it. Don’t think these costs do not apply to you if you own an electric vehicle.
Owning an electric vehicle (EV) may mean no more pumping gas and less maintenance costs, but owning it is no less expensive than owning a traditional car. For starters, EV sticker prices are higher than those of traditional vehicles and cost more to finance. To make matters worse, an EV’s value depreciates much faster than a traditional car’s. Combined, these factors can offset the savings you get in maintenance and fuel costs.
The bottom line is that owning a car is expensive, whether a gas, hybrid, or electric vehicle. The result is the same—America’s love affair with cars drives us into debt and destroys our finances along the way. What’s worse is that we end up paying all these expenses for a vehicle that mostly sits idle and unused.
Your Car Is Like a Lion
Your car is a lot like a lion. Both are fast and powerful but spend most of their time doing nothing. A lion sleeps 18 to 20 hours a day and only wakes to hunt and eat. Similarly, your car spends most of its time parked, only coming alive to transport you short distances.
The Numbers Don’t Lie
There are 24 hours in a day, 168 in a week, and 8,760 in a year. Of all those hours, how many would you guess are spent driving in your car? The number is shockingly low!
On average, Americans drive about one hour each day, which adds up to seven hours per week or 365 hours per year. This means that only 4% of our adult lives are spent in our cars driving.
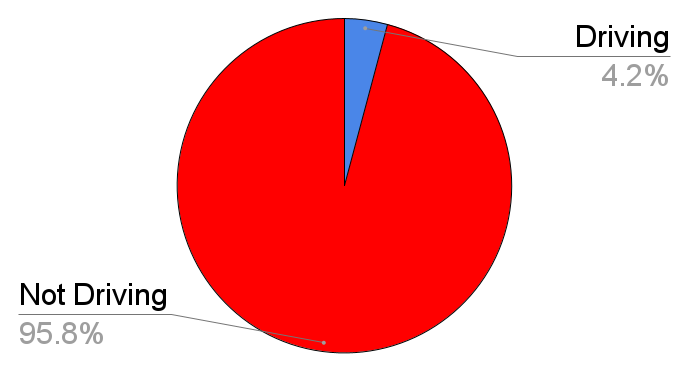
I can already anticipate the argument that many people drive for far more than one hour each day. Let’s say you do and double or triple your driving time. The math still stinks. It would only increase the time you are in your car to 8% and 12.5%, respectively. But let’s be realistic: No one drives three hours every single day of the year. So, unless you work as an Uber driver, you’ll never hit that 12.5% mark.
Others might argue that I am skewing the numbers and should only include waking hours. Okay. Let’s do it.
Let’s say you are one of the rare people who sleeps 8 hours every night, leaving you 16 waking hours. If you are like the average American and drive one hour per day, you would increase your driving time to 6.25%. Even if you drove three hours every single day delivering food for DoorDash, you still would not crack 20%. In other words, over 80% of your waking life would be spent doing something else.
Compared to our cars, the lion doesn’t seem that lazy after all.
This begs the question: Why do we go into extreme debt, paying tens of thousands of dollars for something we use so little?
Car Loans: The Root Of All Evil
In a perfect world, everyone would have enough savings to cover three to six months of living expenses and purchase everything with cash. We would all exercise 30 minutes daily and eat five servings of fruits and vegetables. Our kids would listen to us and be straight-A students. However, that is not the reality for most of us.
In the real world, many people rely on loans to purchase things they otherwise could not afford. This is evident from the trillions of dollars in America’s credit card, auto loan, and student loan debt. For most people, taking out an auto loan is the only viable option to buy a reliable car.
But you need to be aware of the pitfalls of auto loans and why they are such a wealth destroyer. It all comes down to the burden of monthly payments and depreciation.
Monthly Payments
Monthly car payments and loan terms have increased along with car prices to nosebleed levels. Below are 2024 auto loan statistics from LendingTree that show how bad things have gotten.
Average Car Payments And Terms
| Type | Average Car Price | Average Monthly Payment | Average Term (Loan) |
|---|---|---|---|
| New | $40,366 | $738 | 67.9 |
| Used | $26,685 | $606 | 67.4 |
| Leased | – | $532 | 36 |
Seeing how expensive it is to own a car these days is unbelievable. Regardless of your option, paying $538, $606, or $738 monthly for your vehicle will make it difficult to pursue other money goals. Spending over $700 monthly for almost six years can make it challenging to accumulate wealth.
Also, don’t be fooled by the lower monthly payments for leasing a car. It may appear cheaper, but it’s not. A lease is riddled with mileage limitations and costly repair penalties, and when you are done leasing, there is nothing to show for it.
At the end of the lease term, you have three options: either return the lease and walk away with nothing, buy the car at a higher price, or start a new lease. Many people choose to roll into a new lease, which means the monthly payments continue indefinitely.
On the other hand, if you purchase a new or used car with a loan, there is a deadline by which you need to complete the payments. Once you do, you become the owner of the vehicle, and the monthly payments stop.
In the end, whether you buy or lease, the opportunity cost is great. The money you spend on your car is forever lost and cannot be put toward savings and investing.
Opportunity Costs
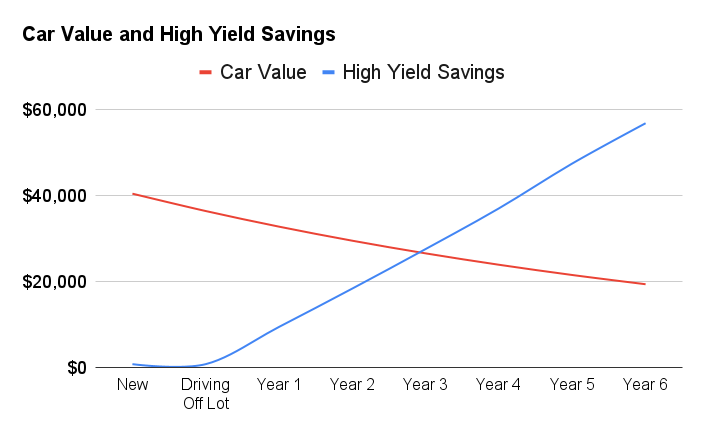
Imagine purchasing a new car worth $40,366 and deciding to finance it by taking out an auto loan at a 7% interest rate for 5.5 years. As a result, you will have to make monthly payments of $720. By the end of the loan period, you will have paid an additional $8,500 in interest charges.
When the loan ends, you will have spent $48,866 ($40,366 + $8,500) to buy a new car that 5.5 years later is only valued at $20,000. This represents a 60% loss and does not include the higher taxes and insurance rates you will pay for a new car.
If I pitched you an investment that was guaranteed to lose you 60% over 5.5 years, would you invest? No way! Instead, you would run away from me as fast as possible.
Now, imagine a scenario where you have saved $15,000 to buy a used car in cash. Since you do not need to make monthly car payments, you deposit the $720 each month into a conservative, high-yield savings account that earns 3% interest. What are the results?
After 5.5 years, you would have over $50,000 in your bank account, which means you would have a net gain of $35,000 ($50,000 – $15,000) plus the car’s value. That number has the potential to be much higher if you decide to invest in something like an S&P 500 index fund.
The major difference between a car and a savings account or an S&P 500 index fund is depreciation. Cars are among the worst depreciating assets you can own.
Depreciation That Rivals Timeshares
When it comes to financial investments, it’s essential to understand the difference between appreciating and depreciating assets.
Buying a house is usually considered a wise investment as it’s an asset that tends to appreciate over time. A house has the potential to boost your net worth by creating equity as you pay off the mortgage and as property prices rise with time. That’s why opting for a fixed-rate mortgage to purchase a house can be a wise investment choice.
Like a mortgage, your auto loan and monthly payments are based on the purchase price minus your down payment. However, unlike a house, your car rapidly depreciates.
Depreciation’s Wealth Destruction
When you buy a car, you are going into debt to purchase an item that will lose almost 10% of its value the second you drive it off the lot. Over the next five years, the car’s value will continue to depreciate, losing almost 50% of its original value. This depreciation can lead to a situation where you owe more on your loan than the actual value of your car. People who get behind on their loans know this all too well.
When you fall behind on your monthly payments, you have few options. You can try to refinance into a new loan, but that will only extend the car loan, causing you to pay more in interest. The other options are to sell the car at a loss or watch it get towed away as it is repossessed. None of these choices eliminate the loan. You still have to pay it back in full even if you no longer process the car.
If you are leasing a car, you have even fewer options. Getting out of the lease can be difficult, and breaking a lease comes with steep penalties. You can be required to pay the remaining months of the lease and face a stiff termination penalty.
The point is that the burden always comes back to the borrower, whether you buy new, used, or leased. This makes it risky to use an auto loan to finance a car that will only decrease in value and that you may not be able to afford. It’s particularly dangerous if you don’t consider the additional costs of owning a car before purchasing.
Hidden Costs Are Everywhere
Two major purchases in your life—your house and your car—come with many hidden costs. If you own a home, you know what I am talking about. Between the repairs, taxes, and routine expenses, there will be times when you wonder if your home’s appreciation is outpacing your costs. A car is no different.
Ramit Sethi, who wrote the bestseller “I Will Teach You to Be Rich,” likes to refer to these hidden costs as phantom costs. He stresses that monthly payments are only part of the expense of car ownership. The chart below shows some typical vehicle costs you must consider when buying a car.
| Car Expense | Average Monthly Cost |
|---|---|
| Fuel | $200 |
| Insurance (Full Coverage) | $150 |
| Maintenance and Repairs | $125 |
| Registration Fee | $25 |
| TOTAL | $500 |
Owning a car costs approximately $500 more per month in addition to the monthly loan payment. Although $500 is a reasonable estimate, I recommend examining your vehicle expenses from the previous year to get a more accurate figure. However, for this example, we will stick with the $500 estimate to demonstrate how costly owning a car can be.
Total Cost of Ownership
If we add the $500 to the average monthly car payments we viewed earlier, we can calculate the average monthly cost of owning a vehicle. The numbers in the chart below are scary.
| Loan Type | Total Monthly Cost | Avg. Monthly Payment | Avg. Monthly Expenses |
|---|---|---|---|
| New | $1,238 | $738 | $500 |
| Used | $1,106 | $606 | $500 |
| Leased | $1,038 | $538 | $500 |
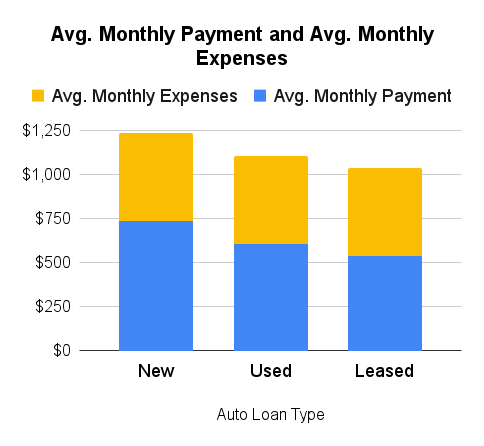
The numbers above are averages and can be higher or lower depending on where you live, your driving history, and your credit score. However, no matter how you look at it, spending over $1,000 monthly on a car can significantly impact your finances. This becomes even more challenging if you have multiple vehicles and auto loans to manage.
This is why scrutinizing and running the numbers is important when making big purchases. We often agonize over the small things, like paying $35 for a carry-on or spending $12 on a glass of wine, but jump into buying a car without a cursory understanding of its actual costs.
When you make big purchases, such as buying a car, it’s essential to consider the opportunity costs. Remember that every dollar spent on paying off your auto loan and maintaining your vehicle is one less dollar going towards savings and investments. That is why it is essential to put guard rails in place that protect you from overextending yourself when buying a car.
Let’s explore ways to put up guardrails, reduce the expense of car ownership, and put more dollars toward your financial goals.
Ways To Reduce Car Costs
1. Follow the 20/4/10 Rule
If you can follow the 20/4/10 rule, you will be way ahead of the game. Here are the three criteria:
- Make a 20% down payment
- Keep auto loan terms of 4 years or less
- Keep total monthly costs to less than 10% of monthly income – car loan, insurance, fuel, maintenance, etc, combined.
My suggestion is to work the rule backward. Let’s look at an example to see how it works.
A couple with a combined yearly income of $84,000 or $7,000 per month is planning to buy a car. They quickly calculate that 10% of $7,000 is $700. Assuming their monthly car expenses are $500, they aim to keep their monthly car payments around $200 to keep their total monthly car costs close to $700.
Next, the couple uses an online auto loan calculator to determine the maximum car price they can afford at $200 per month for 48 months while paying 20% down. After running the numbers, they discover they can afford a car for $10,000 or less.
Using this rule is a great way to estimate what you can comfortably afford, but it has limitations. If your income is on the low end, no amount of massaging will keep your total monthly costs below 10% of your monthly income. If you are in this situation, I strongly suggest keeping it under $10,000 and paying in cash if possible.
It may seem challenging, but I’ve found that buying cars with cash has made a significant difference in my financial life. By avoiding car loans when I was younger, I was able to save and invest even at a lower salary. It’s incredible how this one decision can change the entire trajectory of your financial future.
2. Do Not Shop Monthly Payments
The beauty of the 20/4/10 rule is that it helps you determine the total price of a vehicle that fits your budget while limiting interest charges to 48 months. A common mistake people make is focusing on the monthly payments rather than the total cost of the car. This can lead to financial trouble down the line.
Let’s revisit the couple who used the 20/4/10 rule to determine they could afford a $10,000 vehicle. If they opt for a 72-month loan instead of 48 months, they can upgrade to a $15,000 automobile while maintaining the $200 monthly payments. That may seem like a smart financial move, but it’s not.
By extending their loan from 48 to 72 months, they will pay an extra $2,000 in interest in addition to the additional $5,000 in price. Their monthly payment might still be $200, but they will spend $7,000 more than if they had bought the $10,000 car with a 48-month loan.
If you shop by monthly payments, it can be far too tempting to extend the loan so that you can afford a more expensive car. That is how so many people overpay for a vehicle. Here is one more example to illustrate the point.
Pop Quiz
You are looking to purchase a new full-size SUV and have found one for $40,000. After running your numbers using the 20/4/10 rule, you have decided to put 20% down and finance the remaining amount by taking out a 48-month auto loan at 7% interest. This will result in a monthly payment of $766. However, the finance manager at the dealership has suggested a 72-month loan, which would lower your monthly payments to $546, saving you almost $200 per month.
What would you do? Will you keep the 48-month loan or accept the finance manager’s advice and go for a 72-month loan? The 72-month loan will decrease your monthly payments by almost $200. That sounds nice, but does it save you money? Let’s have a look.
| Loan Details | 48-Month Loan | 72-Month Loan |
|---|---|---|
| Vehicle Price | $40,000 | $40,000 |
| Interest Rate | 7% | 7% |
| Down Payment | $8,000 | $8,000 |
| Loan Amount | $32,000 | $32,000 |
| Monthly Payment | $766 | $546 |
| Total Interest Payments | $4,781 | $7,281 |
| Total Loan Payments | $36,781 | $39,281 |
You will pay $2,500 more by opting for the 72-month auto loan over the 48-month loan. This is why you should never shop for anything, let alone a car, based on the monthly payments.
Always remember that the finance manager at the dealership is not your friend. They are not trying to lower your monthly payments out of the kindness of their hearts. Instead, the dealership is taking advantage of the situation.
They know that most people shop by monthly payment, not total cost. By extending the loan terms, you are getting a raw deal disguised as lower monthly payments. It is a win-win for the dealership and finance manager but not for you.
3. Buy Used
I have been driving for over 30 years, and during this time, I have only purchased two brand-new cars using an auto loan. The rest of my vehicles have been used, and I paid for them in cash. I paid off both new cars in under 48 months, meaning I only carried an auto loan for six years out of those 30. It is incredible how much money you can put toward savings and investing when not burdened by a hefty auto loan.
When it comes to buying a car, purchasing one that is a few years old may be a better option than buying a brand-new one. The reason is that new cars tend to lose 30% to 40% of their value due to depreciation within the first three years of ownership. This means you can purchase what was originally a $40,000 car three years later for around $25,000. Those are big-time savings.
I understand that during the COVID-19 pandemic, the value of used cars increased. However, this was a rare event, similar to the pandemic itself. In normal circumstances, buying a used vehicle can be a cost-effective option. So, to save money on a car, consider purchasing a used one.
4. Shop Around and Online
My final piece of advice is to shop around and shop online. Use the internet to your advantage. If you are in the market for a new or used car, do as much shopping and negotiating online as possible to avoid stepping into the wolf’s den.
Before closing on a deal, shop for the best auto loan at the best interest rate. The dealership makes most of its money off the financing of the vehicle and does not want to lose that money. Use that to your advantage to get the best possible loan available. It may be the loan at the dealership, or it may not (but don’t let them trick you by adjusting loan terms!).
Do the same with auto insurance. Go online and get multiple quotes. This does not mean you should always choose the cheapest insurance, but you must know your options. You may discover you can get the same coverage or better by switching to another insurance company.
Lastly, get multiple quotes on maintenance and repairs, as they can be the most costly part of owning a car. Don’t be afraid to question the diagnosis and repair costs.
The bottom line is that by taking the time to research and get different quotes, you can save hundreds, if not thousands, of dollars over the life of your vehicle. So, take the time to explore your options. Your best choice may not always be the cheapest, but you will never know unless you research.
Conclusion: Why Your Car is the Ultimate Wealth Destroyer
If you’ve made it this far, I thank you. I presented many data and numbers to demonstrate how owning a vehicle can drain your finances. From the initial cost of buying a car and paying for insurance, fuel, and repairs, it’s no surprise that many Americans struggle to save when so much of their income goes toward their vehicles.
What makes automobiles such a bad investment is that they are a depreciating asset. You are losing money from the very second you buy one. Sinking money into a depreciating asset is one of the fastest ways to hinder your ability to build wealth. But, for most of us, owning one is our only option.
Therefore, we must safeguard ourselves from overspending on our vehicles. The best thing we can do is know our numbers and avoid shopping by monthly payments. Buying a used car also helps. It is also a good idea to shop around and online wherever possible to get the best possible deals.
In the end, it is all about understanding opportunity costs. Every dollar you put into your depreciating car is one less dollar you can put toward investing in assets and securities that appreciate. Appreciation allows the magic of compounding to work in your favor.
Remember, the true path to wealth lies in the power of compound growth – not in a depreciating asset like your car.

